
Gold Price 2021 – Annual Chart and Gold Price Trend
If you are interested in the gold price in 2021, this page provides a complete historical overview of price movements throughout the year, including monthly averages and an interactive chart. Gold prices in 2021 are presented in historical context from January through December, allowing you to easily examine how prices moved throughout the completed year. The page also includes an overview of the key factors that influenced gold prices during 2021 and shaped conditions across global financial markets.
Gold Price in 2021 – Annual Chart and Monthly Overview
Gold price by year
Gold rate for the period
GOLDEN BULLS FOR PROFITABLE INVESTMENTS TODAY IN VIEW OF RISING PRICES
-
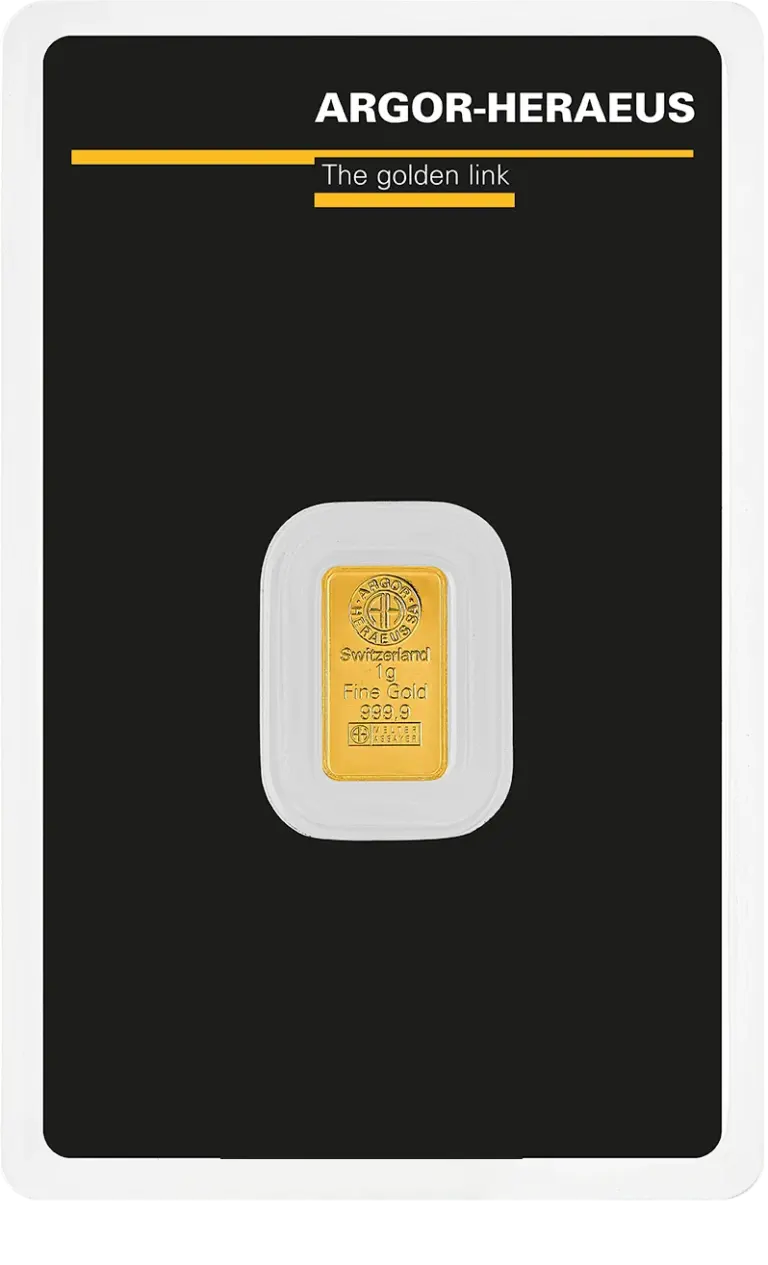
- Fine gold999.9
- Weight1 gram
- ProducerArgor-Heraeus
-
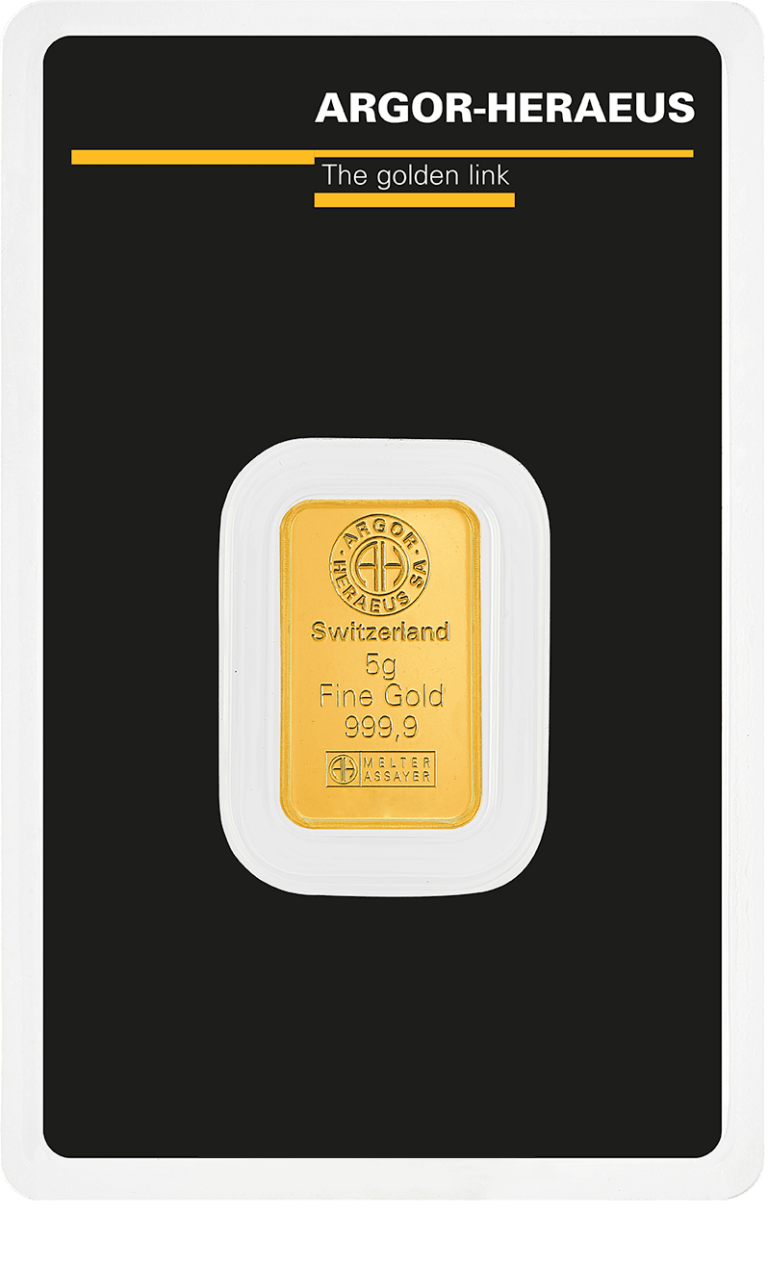
- Fine gold999.9
- Weight5 grams
- ProducerArgor-Heraeus
-
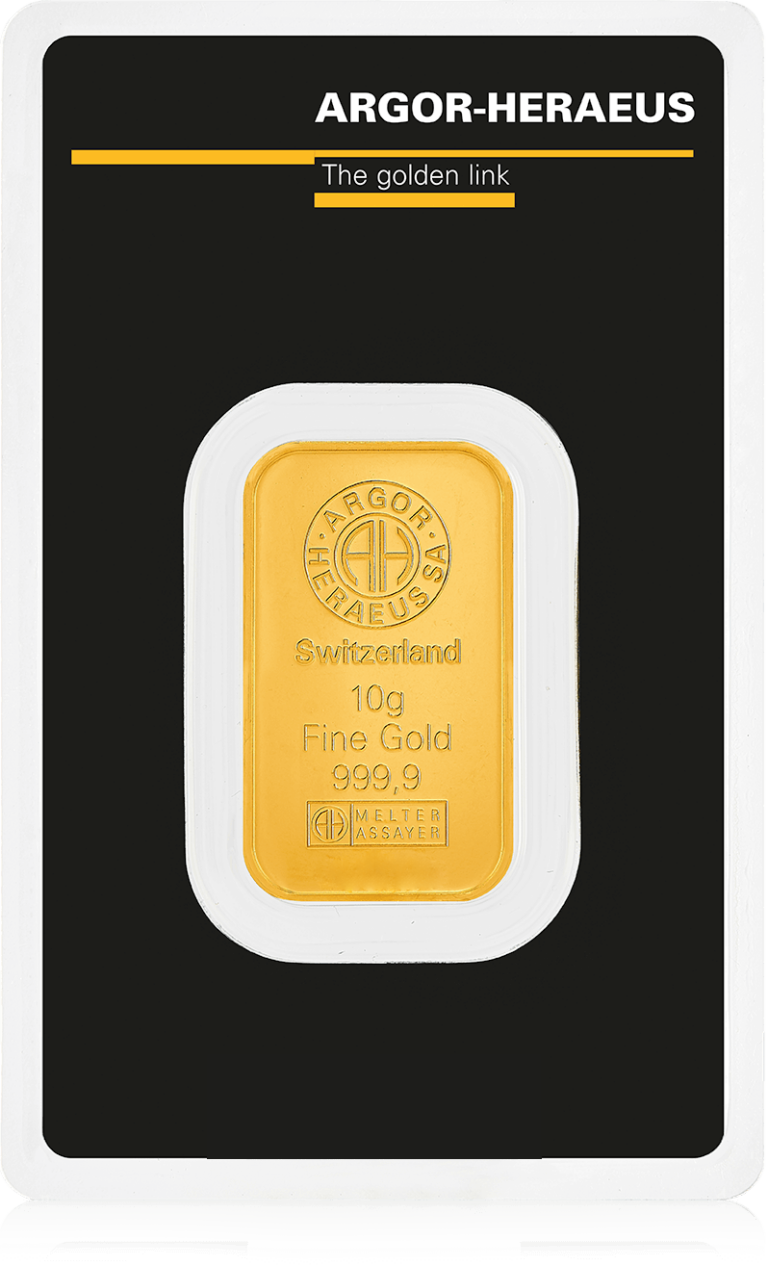
- Fine gold999.9
- Weight10 grams
- ProducerArgor-Heraeus
-
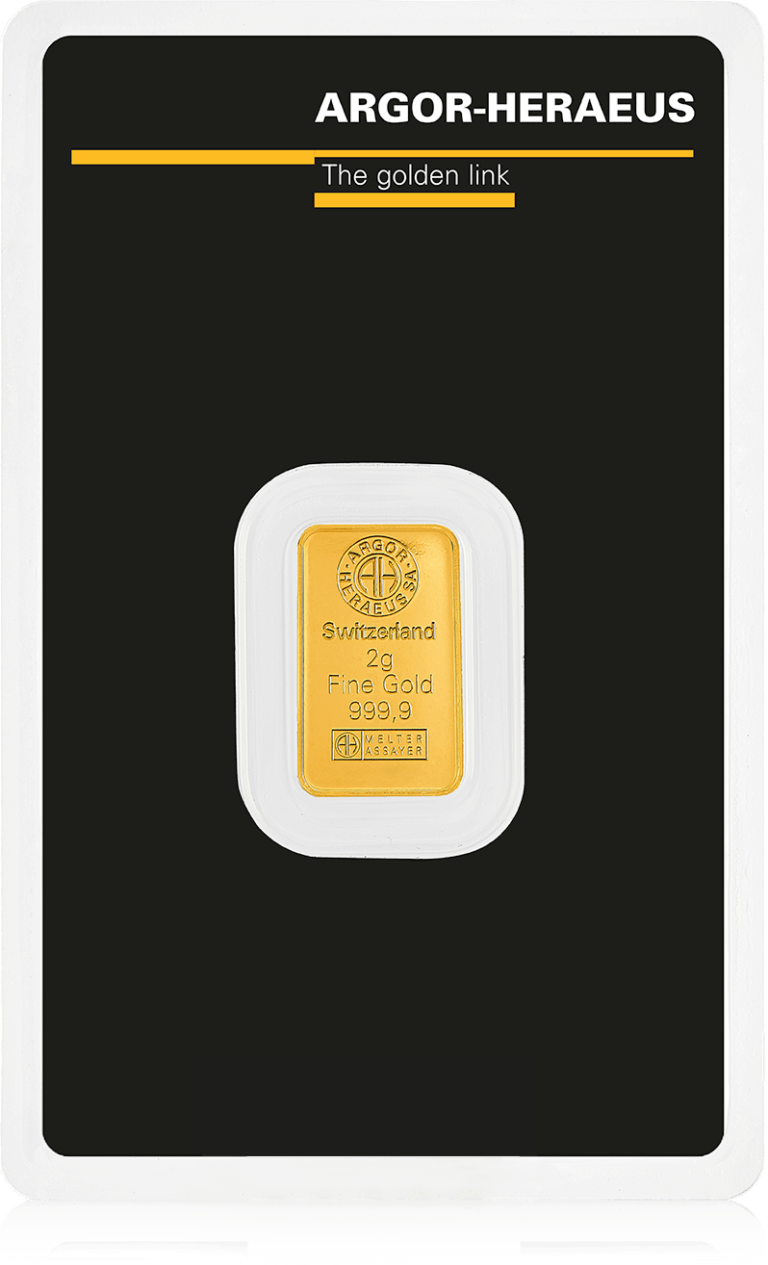
- Fine gold999.9
- Weight2 grams
- ProducerArgor-Heraeus
-
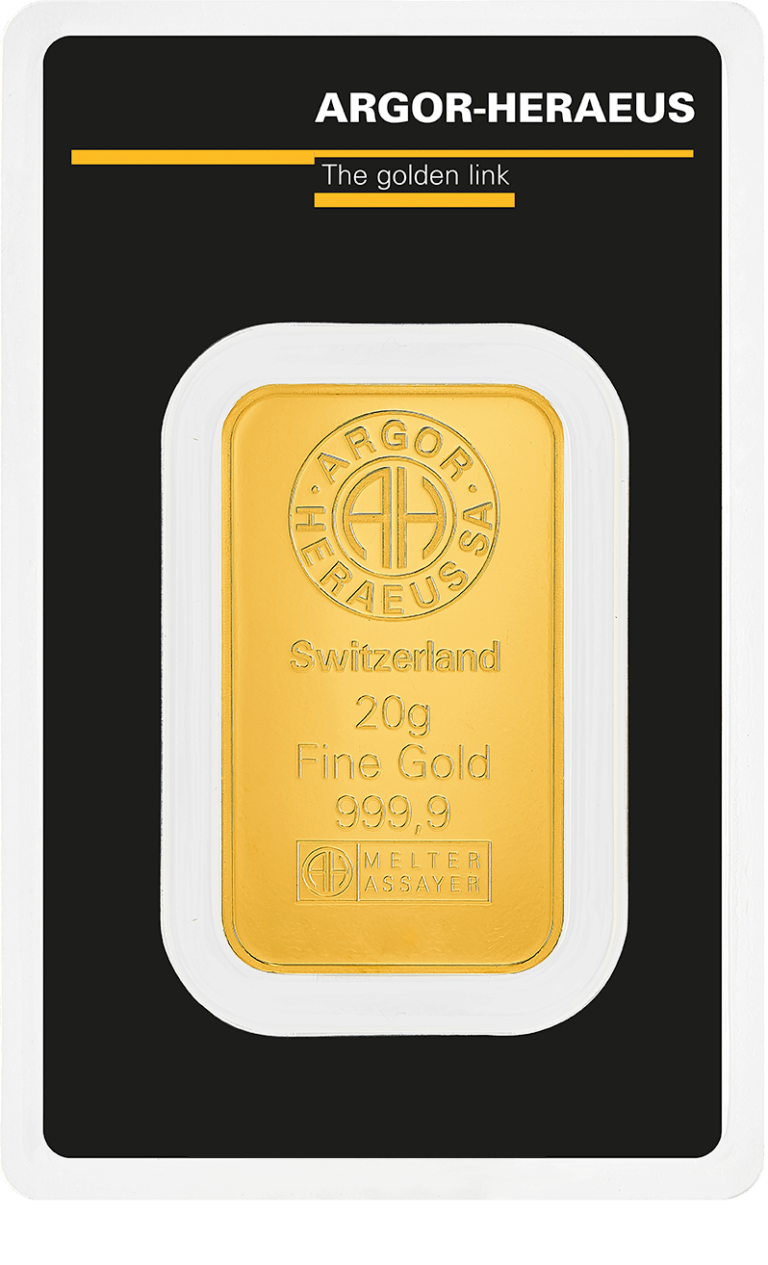
- Fine gold999.9
- Weight20 grams
- ProducerArgor-Heraeus
The 2021 gold price is displayed in an interactive annual chart covering price movements from January through December. The chart allows you to track monthly averages, significant upward and downward trends, and the overall pattern of price movements throughout the year. This makes it easy to compare different periods and better understand how gold prices evolved over the course of the completed year.
The page also includes a table of monthly average prices, providing additional historical context to complement the chart. Gold prices in 2021 experienced periods of volatility as well as more stable market conditions, with prices responding to economic developments, monetary policy, and investor sentiment across global markets. Gold price movements during the year were also influenced by inflation expectations and fluctuations in the U.S. dollar exchange rate. As a result, the annual chart provides a comprehensive overview of gold price performance throughout the entire year of 2021.
Explore gold price performance in 2024, 2025 and the current gold price on DealFin.
What Influenced the Gold Price in 2021?
Gold price movements throughout 2021 were influenced by a combination of global factors that shaped investor behavior and demand for safe-haven assets. Inflation, central bank policies, interest rate developments, and fluctuations in the U.S. dollar exchange rate against the euro all played important roles during the year. Gold prices also responded to geopolitical events and changing investor sentiment across global financial markets. Another significant factor was the uncertainty surrounding the global economic recovery and the differing pace of growth among the world’s major economies.
Historical gold price performance shows that similar factors have influenced the market during previous periods of economic uncertainty. As a result, gold in 2021 was viewed not only as a commodity but also as a tool for portfolio diversification and wealth preservation. Increased demand came from both private investors and central banks responding to changing economic conditions and heightened market volatility. Demand for gold was also supported by investors seeking assets traditionally regarded as protection against inflation and uncertainty in financial markets.
Frequently Asked Questions – Gold Price 2021
