
Gold Price Chart – 20 Years of Historical Gold Price Performance
If you are interested in how the price of gold has changed over the past two decades, this page provides an interactive chart illustrating the long-term development of the market. This broader perspective helps you better understand long-term trends that are often hidden by short-term price movements. The page also includes a brief historical overview explaining the key factors that influenced gold prices throughout the analyzed period.
Gold Price Performance Over the Last 20 Years – Chart and Commentary
Gold price by year
Gold rate for the period
GOLDEN BULLS FOR PROFITABLE INVESTMENTS TODAY IN VIEW OF RISING PRICES
-
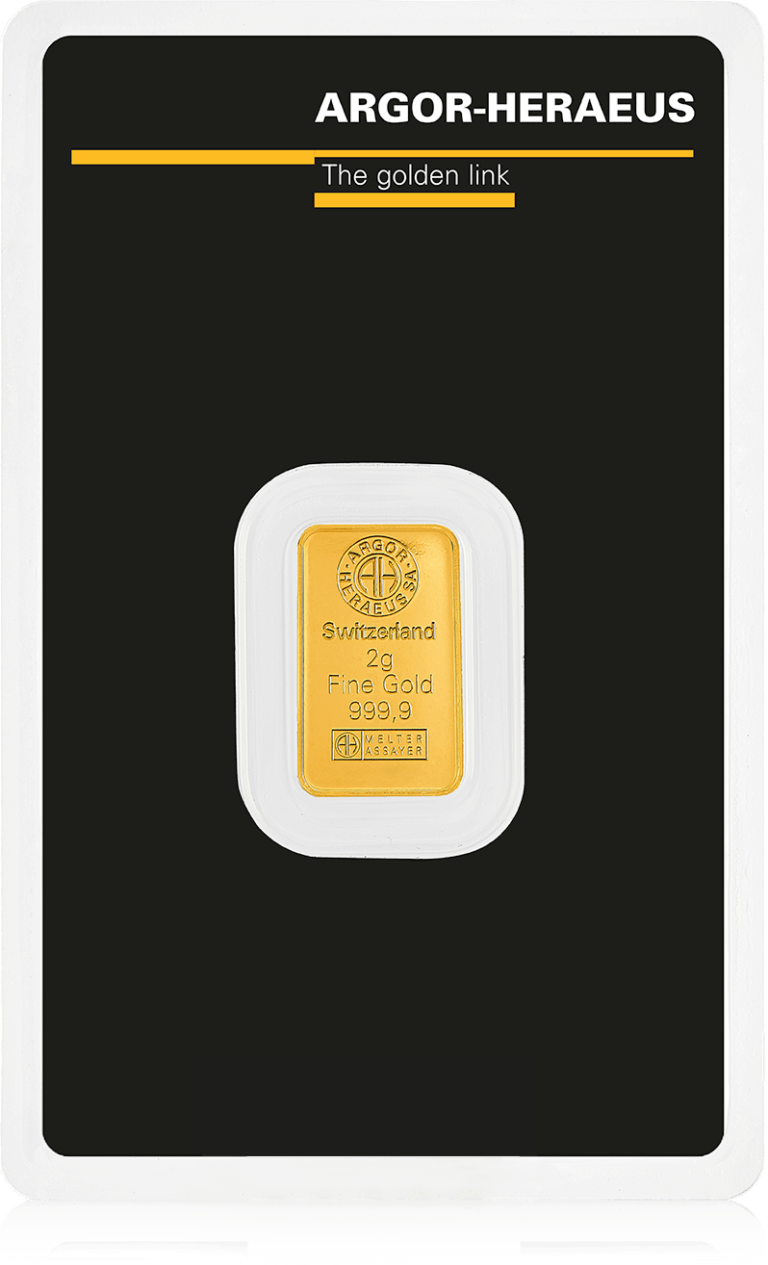
- Fine gold999.9
- Weight2 grams
- ProducerArgor-Heraeus
-
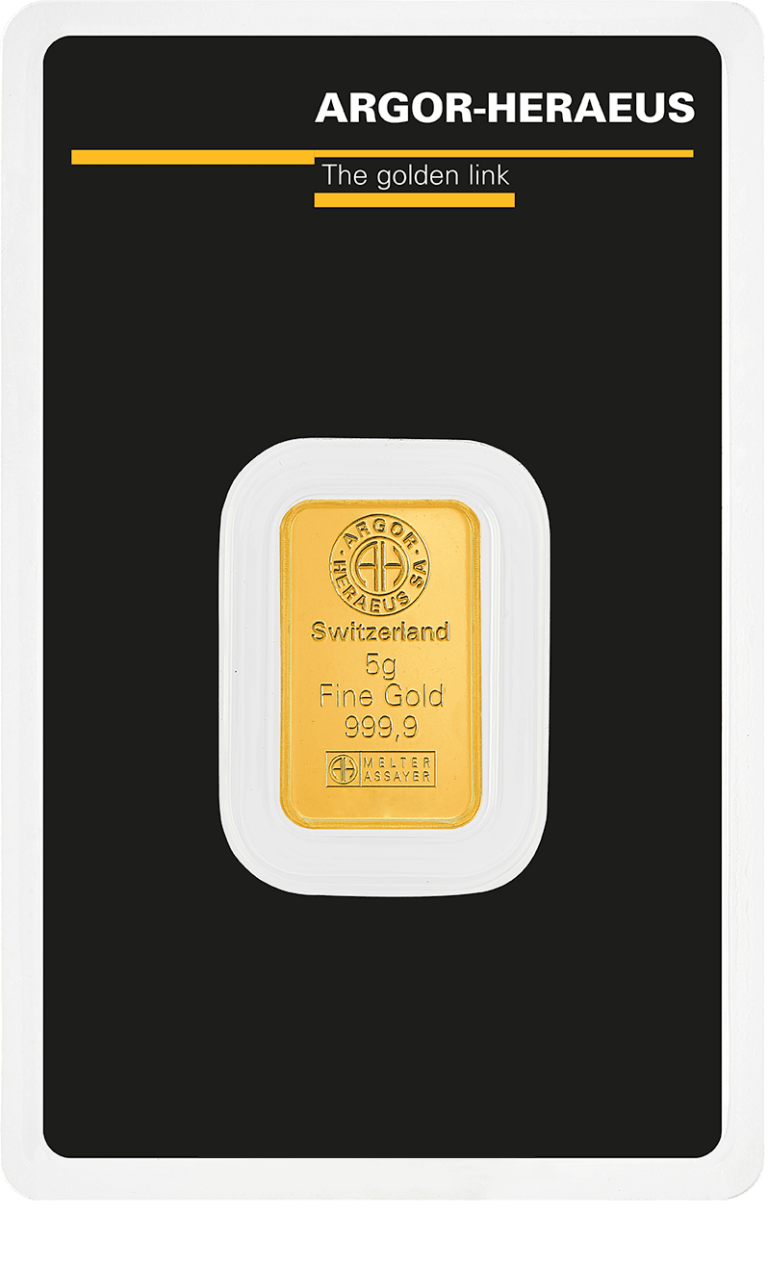
- Fine gold999.9
- Weight5 grams
- ProducerArgor-Heraeus
-
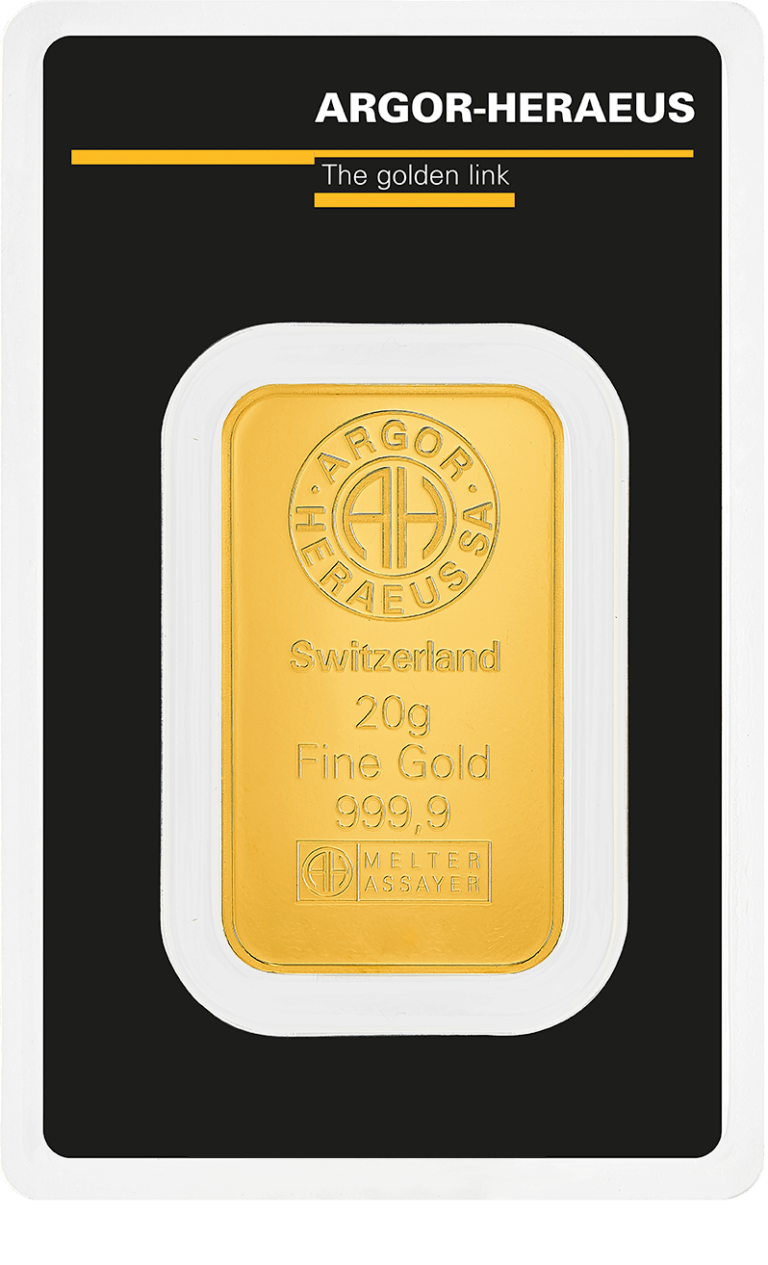
- Fine gold999.9
- Weight20 grams
- ProducerArgor-Heraeus
-
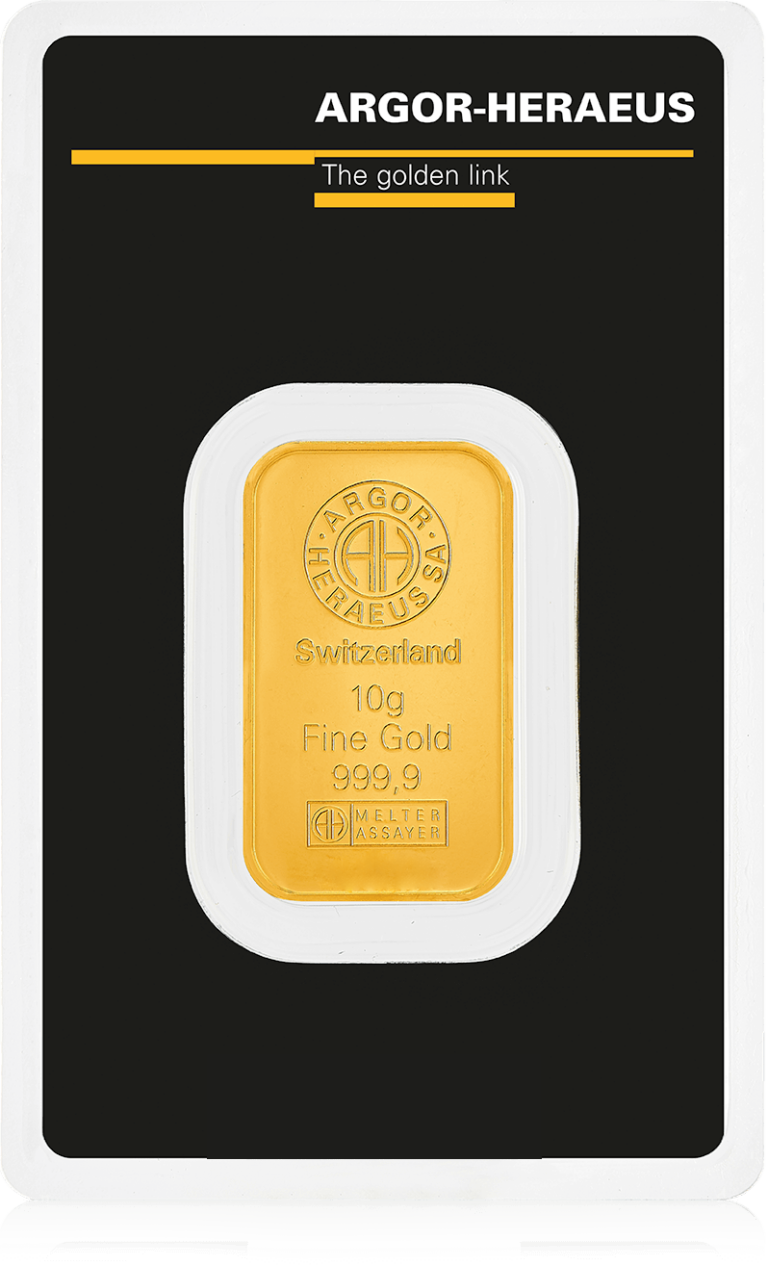
- Fine gold999.9
- Weight10 grams
- ProducerArgor-Heraeus
-
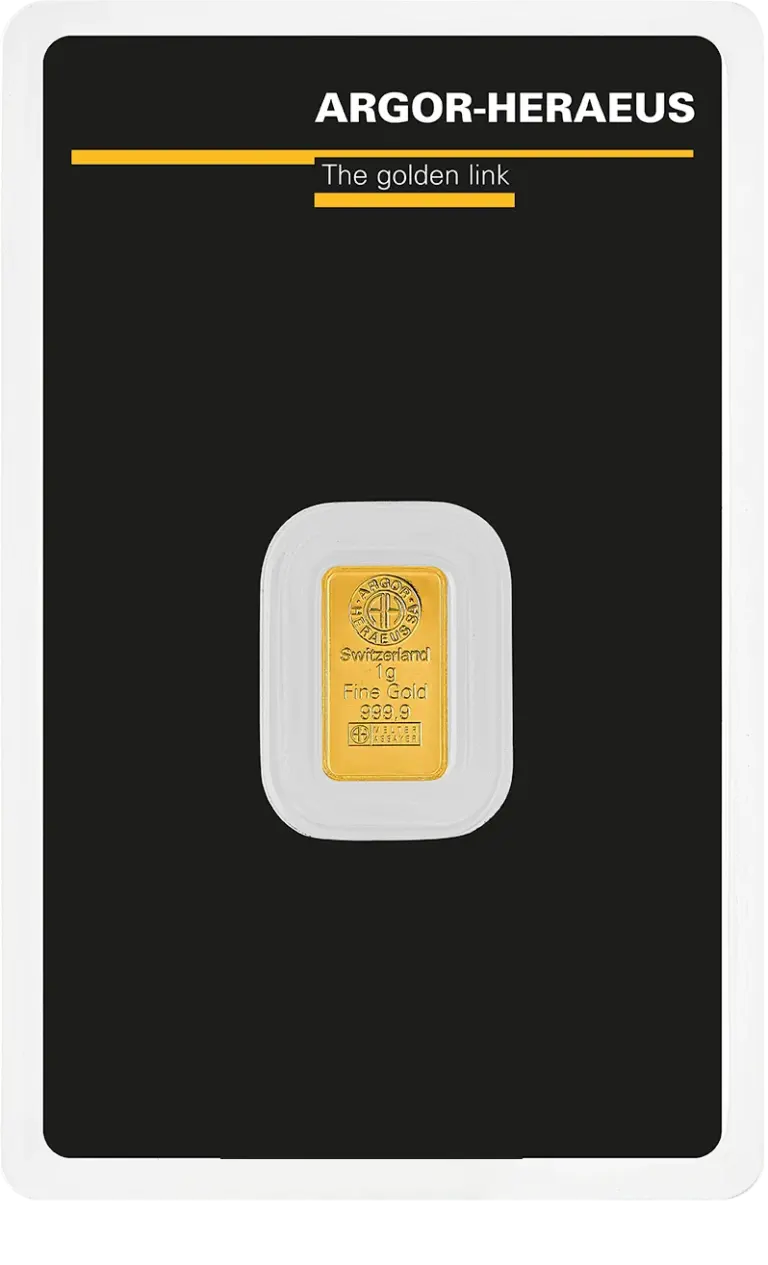
- Fine gold999.9
- Weight1 gram
- ProducerArgor-Heraeus
The interactive chart presents the performance of gold prices over the last 20 years, including periods of strong growth, market corrections, and more stable phases. It displays annual averages, the long-term market trend, and periods when investor sentiment in financial markets changed significantly. Thanks to the extended time horizon, it is easier to understand how the gold market behaved across different economic environments.
Gold prices over the past 20 years have responded not only to individual events but also to broader economic conditions. During periods of elevated inflation or geopolitical tensions, demand for gold generally increased, while calmer market conditions resulted in more stable price performance. As a result, the historical performance of gold prices has not followed a linear path but has changed both in pace and character depending on conditions in global financial markets.
The 20-year chart also reveals much more than short-term price fluctuations. It provides a clearer view of complete economic cycles and helps explain why gold has long been regarded as an asset that is highly sensitive to inflation, monetary policy, and periods of uncertainty in the global economy.
See the current gold price and the live gold chart on DealFin.sk.
What Influenced Gold Prices Over the Last 20 Years?
The long-term performance of the gold market has been shaped by multiple factors that have interacted throughout different periods. Inflation, central bank policies, interest rate developments, and movements in the U.S. dollar against other currencies have all played significant roles. Gold prices over the past 20 years have also responded to changes in investor sentiment and increasing demand for safe-haven assets during periods of uncertainty.
The historical performance of gold prices has been strongly influenced by periods of financial turmoil, inflationary pressures, and geopolitical conflicts. During times of heightened uncertainty, demand for gold often increased not only among investors but also among central banks, which expanded their gold reserves. Some market phases were more dynamic, while others remained relatively stable, but the long-term trend consistently showed that gold remained closely linked to the broader economic environment.
Gold price performance over the past two decades has also reflected changes in the global financial system. The market responded not only to individual news events or short-term developments but primarily to longer-term economic and monetary trends that shaped investor behavior worldwide.
Explore gold price performance year by year with annual charts from 2020 onward on DealFin.sk.
Frequently Asked Questions – Historical Gold Price Performance
