
Gold Price Chart Over 100 Years – Historical Gold Price Trends
If you’re interested in the 100-year history of gold prices, this page provides the broadest historical perspective on gold price movements through an interactive chart and a detailed overview of the market’s key historical periods. The long-term chart helps explain how gold responded to economic crises, inflation, and geopolitical changes throughout different stages of the modern economy. The page also includes a concise historical overview of the gold market’s development over the past century.
Gold Price Chart Over 100 Years – Overview of Historical Eras
Gold price by year
Gold rate for the period
GOLDEN BULLS FOR PROFITABLE INVESTMENTS TODAY IN VIEW OF RISING PRICES
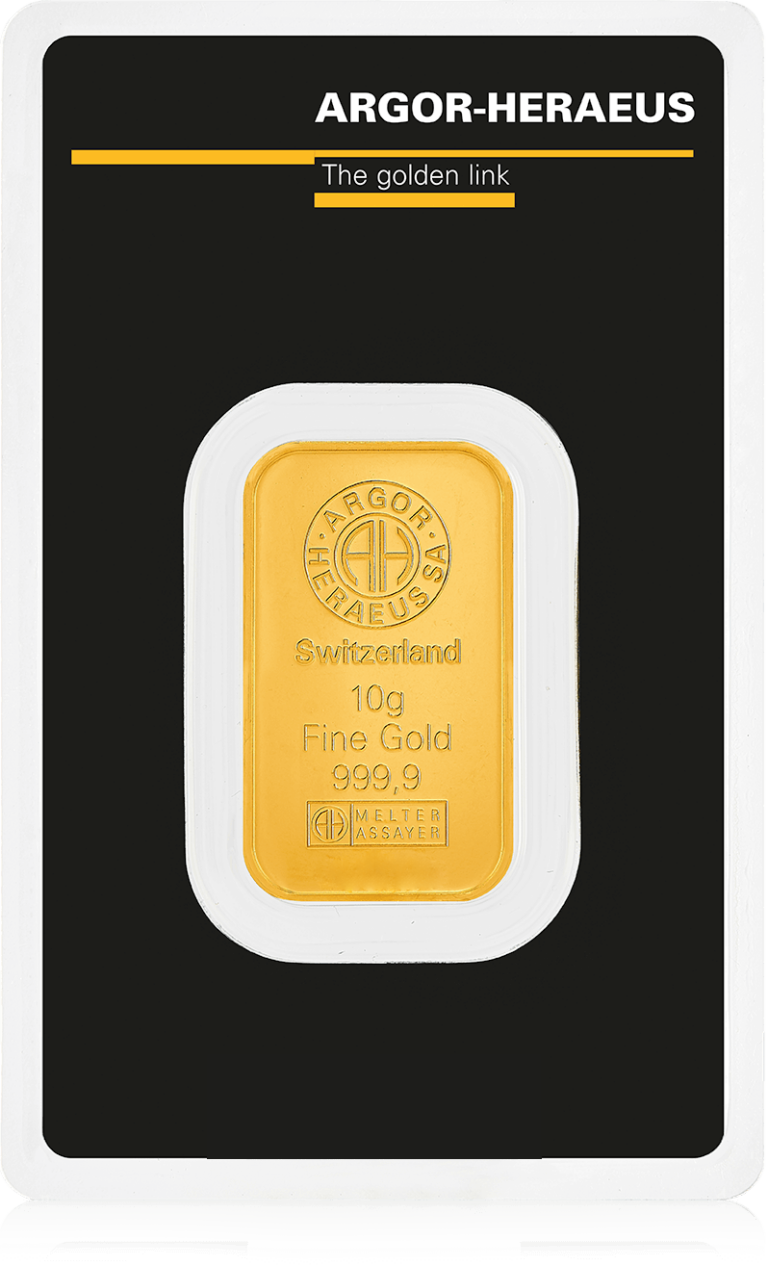
-
- Fine gold999.9
- Weight10 grams
- ProducerArgor-Heraeus
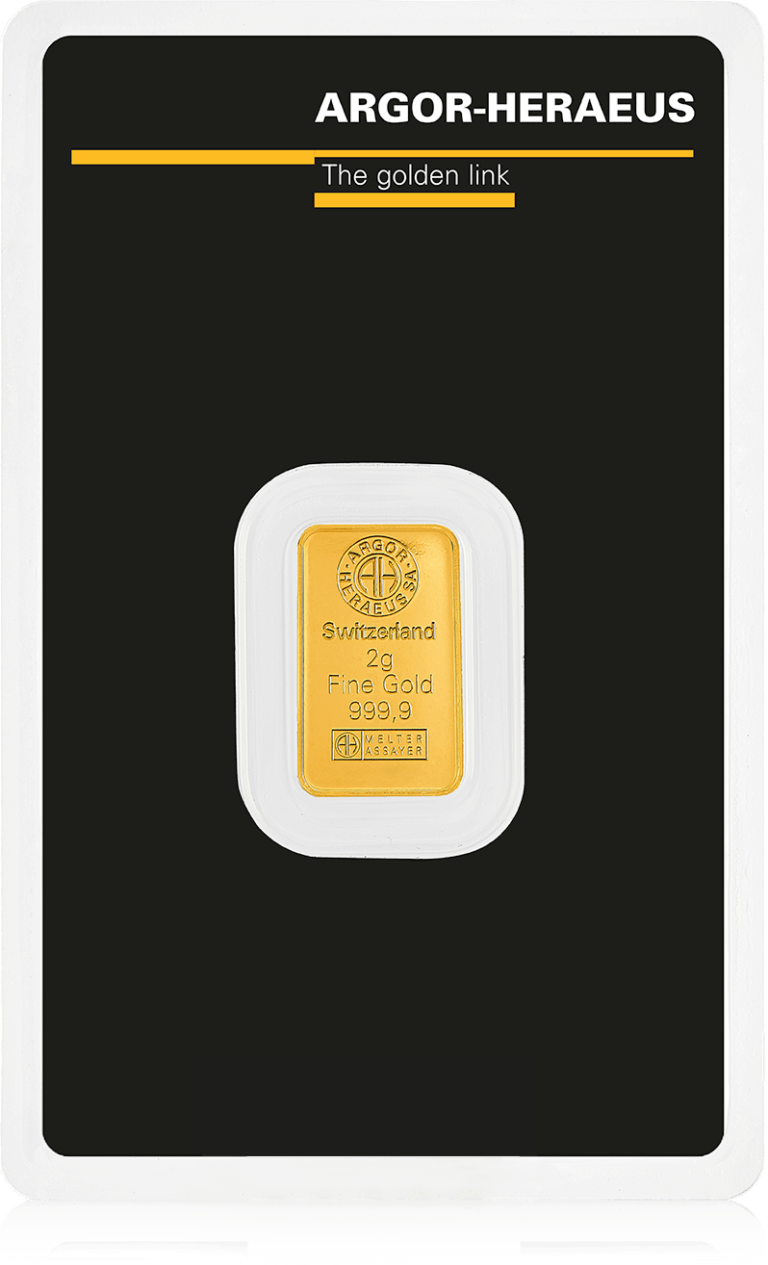
-
- Fine gold999.9
- Weight2 grams
- ProducerArgor-Heraeus
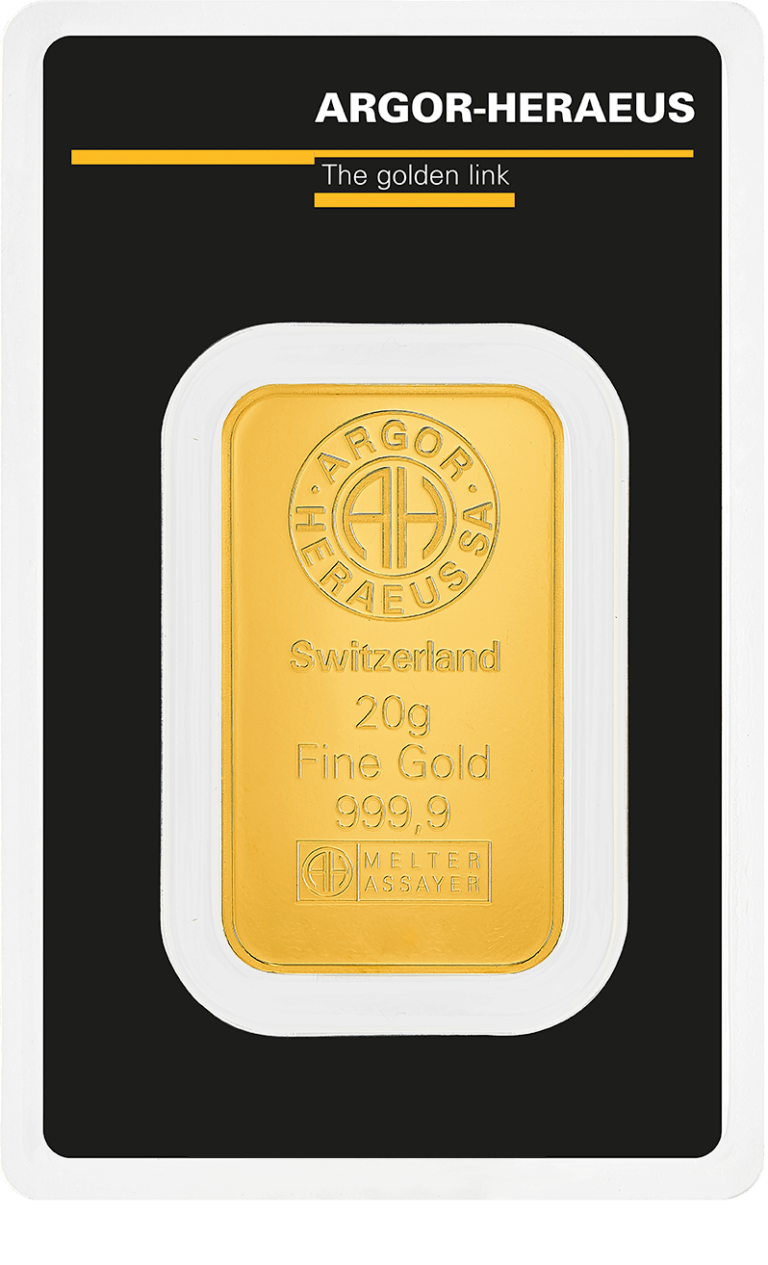
-
- Fine gold999.9
- Weight20 grams
- ProducerArgor-Heraeus
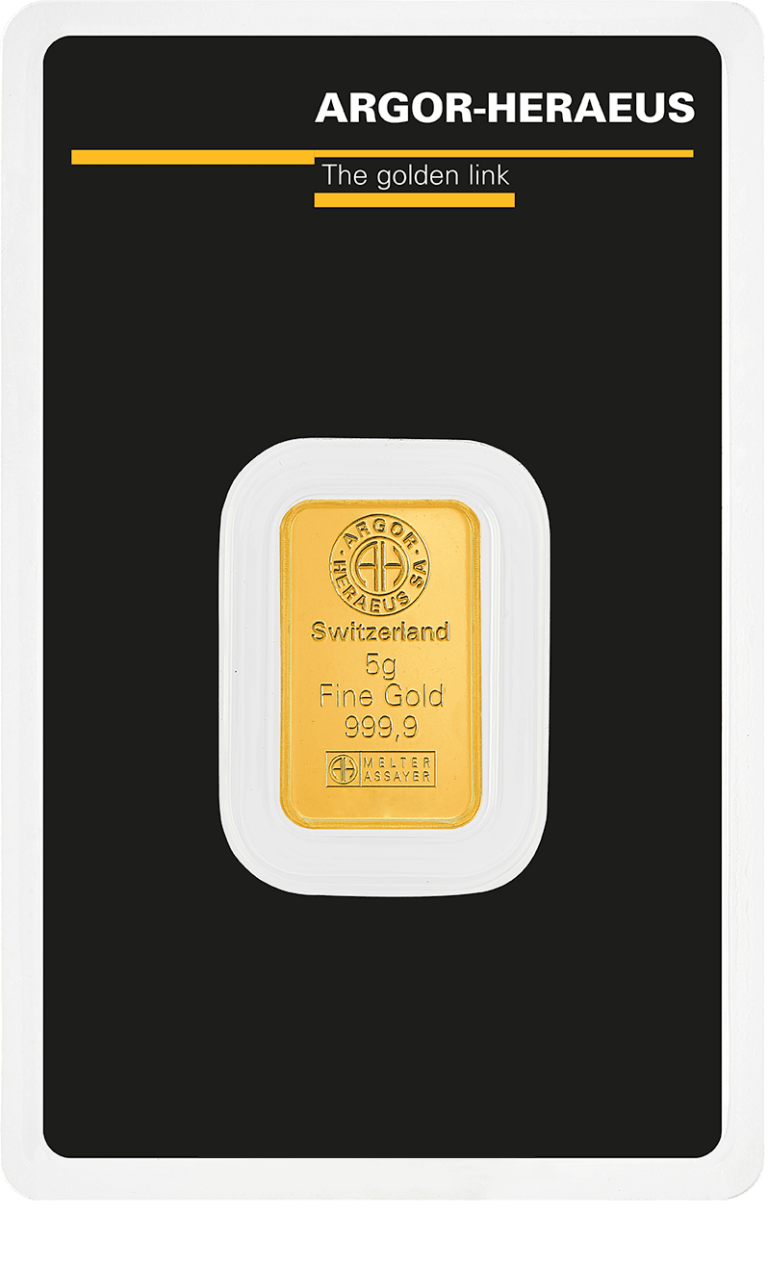
-
- Fine gold999.9
- Weight5 grams
- ProducerArgor-Heraeus
-
- Fine gold999.9
- Weight1 gram
- ProducerArgor-Heraeus

The interactive chart illustrates 100 years of gold price history, including the long-term trend, major peaks, periods of stagnation, and significant market movements. It allows you to see how gold prices changed across different economic systems and geopolitical eras in one place. The extended time horizon also makes it easier to understand relationships that often remain hidden in shorter-term charts.
The historical development of gold prices was strongly influenced by changes in the monetary system, periods of high inflation, oil shocks, and global financial crises. During times of uncertainty, demand for gold typically increased, while more stable economic periods brought calmer market conditions. Gold prices also responded to changes in central bank policies and overall confidence in the financial system.
Looking across the entire century, it becomes clear that gold did not simply move through periods of growth or decline. The market evolved in cycles and frequently reacted to broader economic and geopolitical changes around the world. That is why a 100-year gold price chart provides a much broader perspective than shorter historical periods and offers a better understanding of the long-term nature of the gold market.
See the current gold price and the live gold chart on DealFin.sk.
What Determines the Long-Term Development of Gold Prices?
The long-term development of gold prices is shaped by a combination of economic, monetary, and geopolitical factors that influence global demand for gold. The most important include inflation, real interest rates, the strength of the U.S. dollar, and the policies of central banks such as the Federal Reserve (Fed) and the European Central Bank (ECB). Demand from investors, central banks, and industry also plays a significant role.
The historical development of gold prices also shows that the market’s long-term trend has often differed from short-term movements driven by current news or investor sentiment. Short-term fluctuations tend to be more pronounced during periods of uncertainty, while the broader trend is primarily shaped by structural economic changes, inflation, and geopolitical tensions. As a result, the 100-year history of gold prices reflects long-term changes in the financial system more accurately than individual short-term events.
Throughout the past century, the gold market has repeatedly demonstrated that periods of economic turmoil increase demand for assets perceived as stores of value. Gold price movements have therefore been closely linked not only to economic conditions but also to investors’ confidence in the stability of currencies, banking systems, and global financial markets.
Frequently Asked Questions – 100-Year Gold Price History
