
Gold Price Chart for the Last 10 Years – Historical Gold Price Performance
If you are interested in the long-term performance of gold, this page provides an overview of how the market has evolved over the past 10 years as well as within a broader historical context. Here you will find an interactive gold price chart together with comparisons of key periods when the market reacted to inflation, economic uncertainty, or changes in monetary policy. The 10-year gold price chart helps you better understand the difference between short-term price fluctuations and the long-term market trend.
Gold Price Performance Over the Last 10 Years – Chart and Commentary
Gold price by year
Gold rate for the period
GOLDEN BULLS FOR PROFITABLE INVESTMENTS TODAY IN VIEW OF RISING PRICES
-
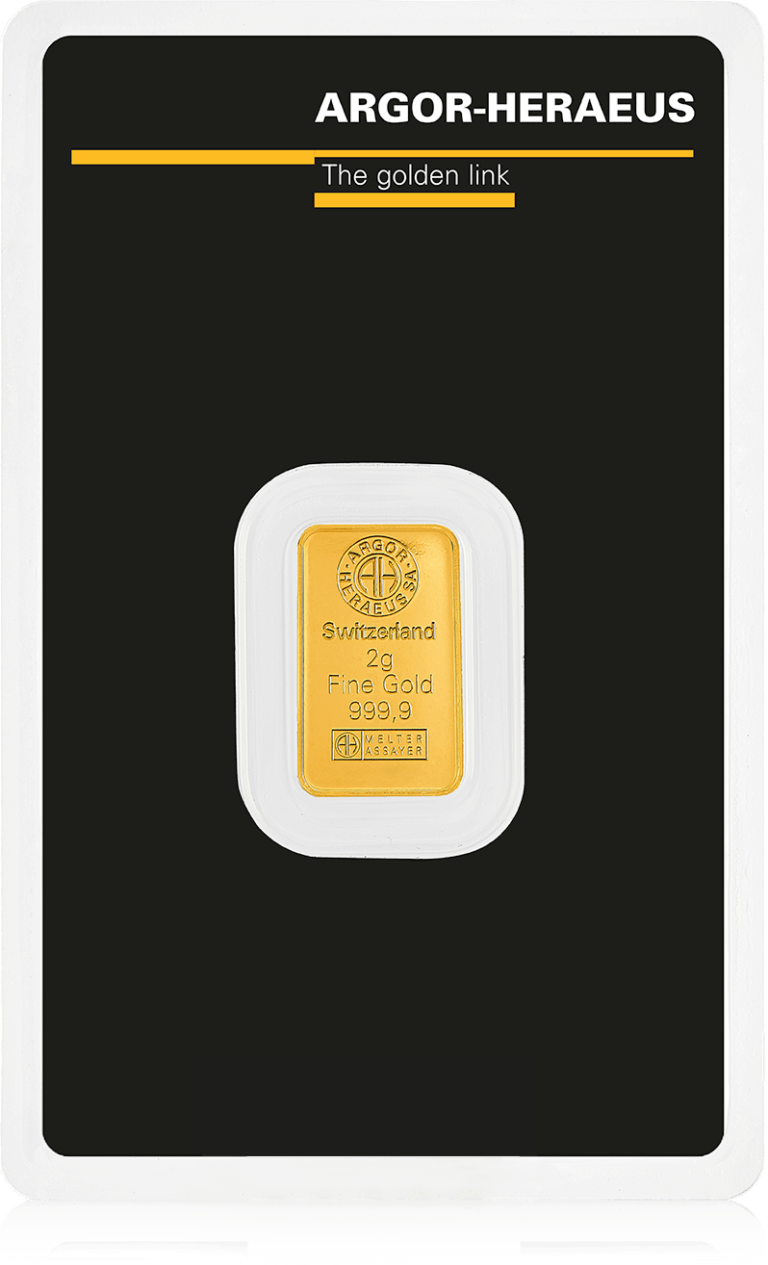
- Fine gold999.9
- Weight2 grams
- ProducerArgor-Heraeus
-
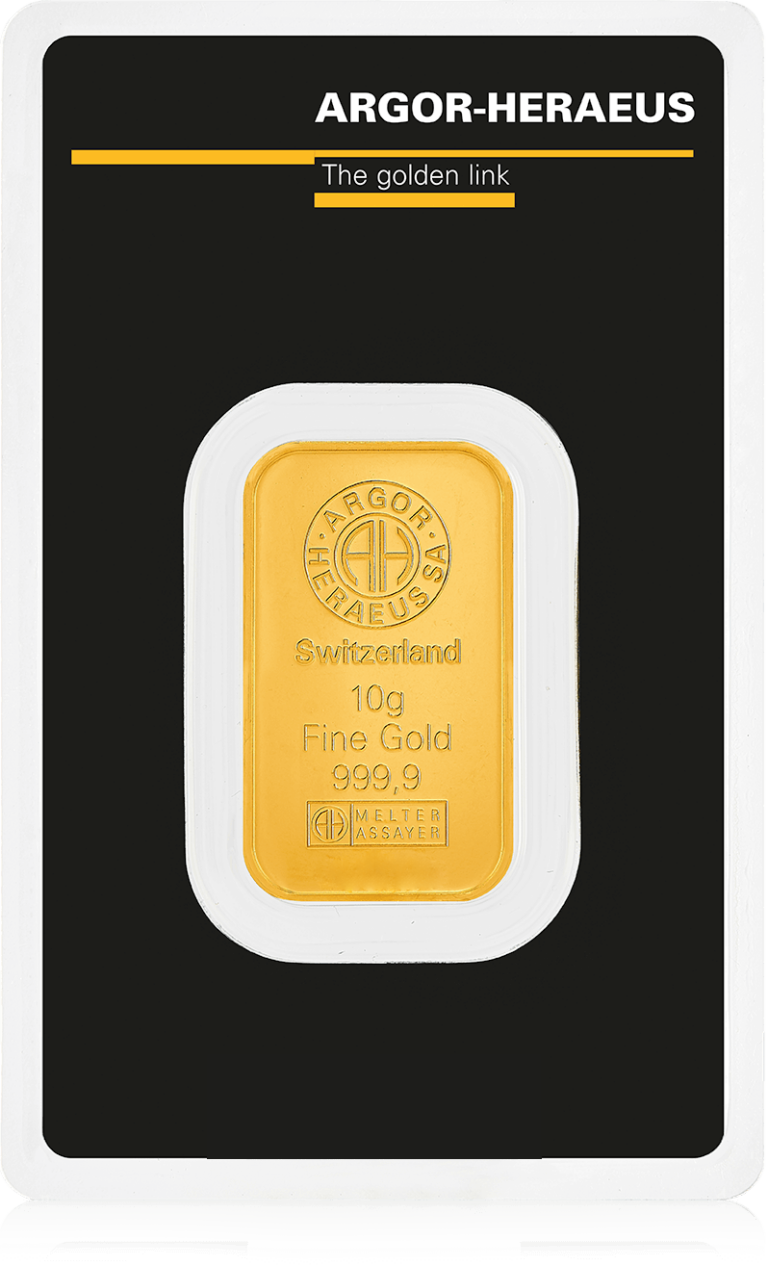
- Fine gold999.9
- Weight10 grams
- ProducerArgor-Heraeus
-
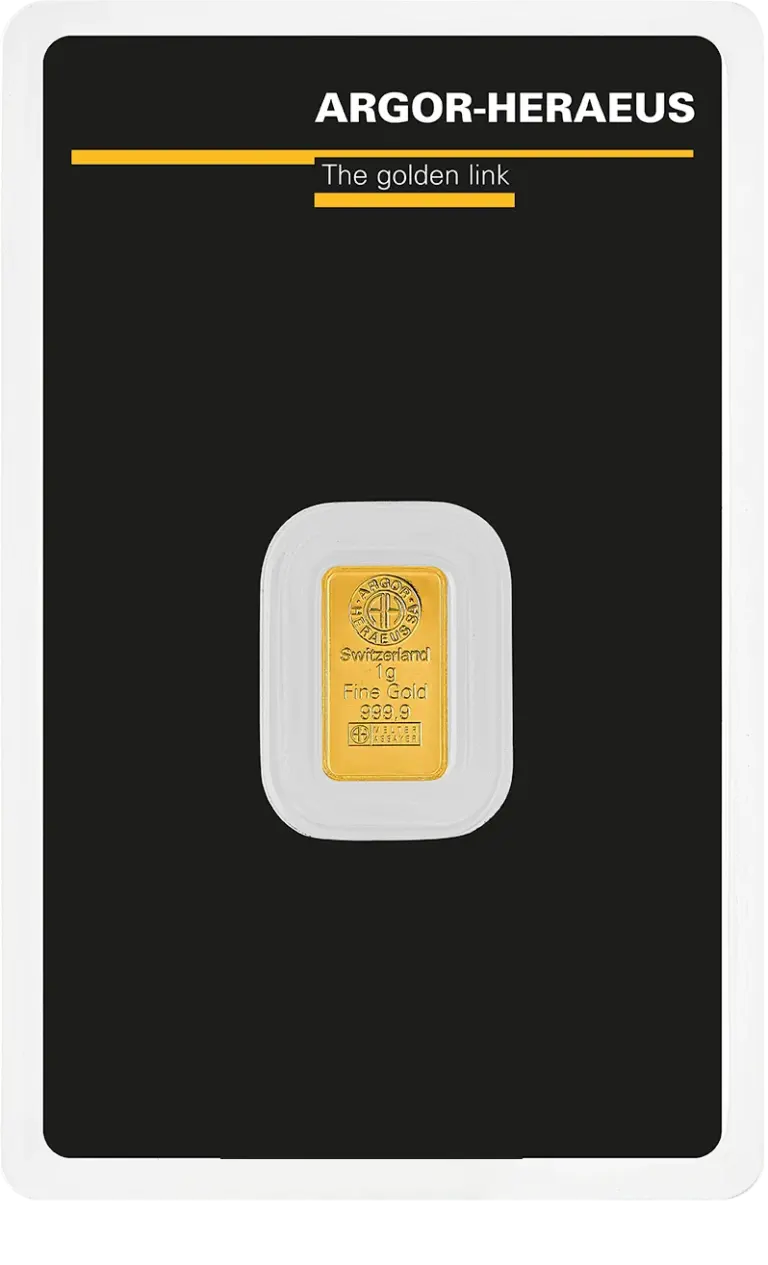
- Fine gold999.9
- Weight1 gram
- ProducerArgor-Heraeus
-
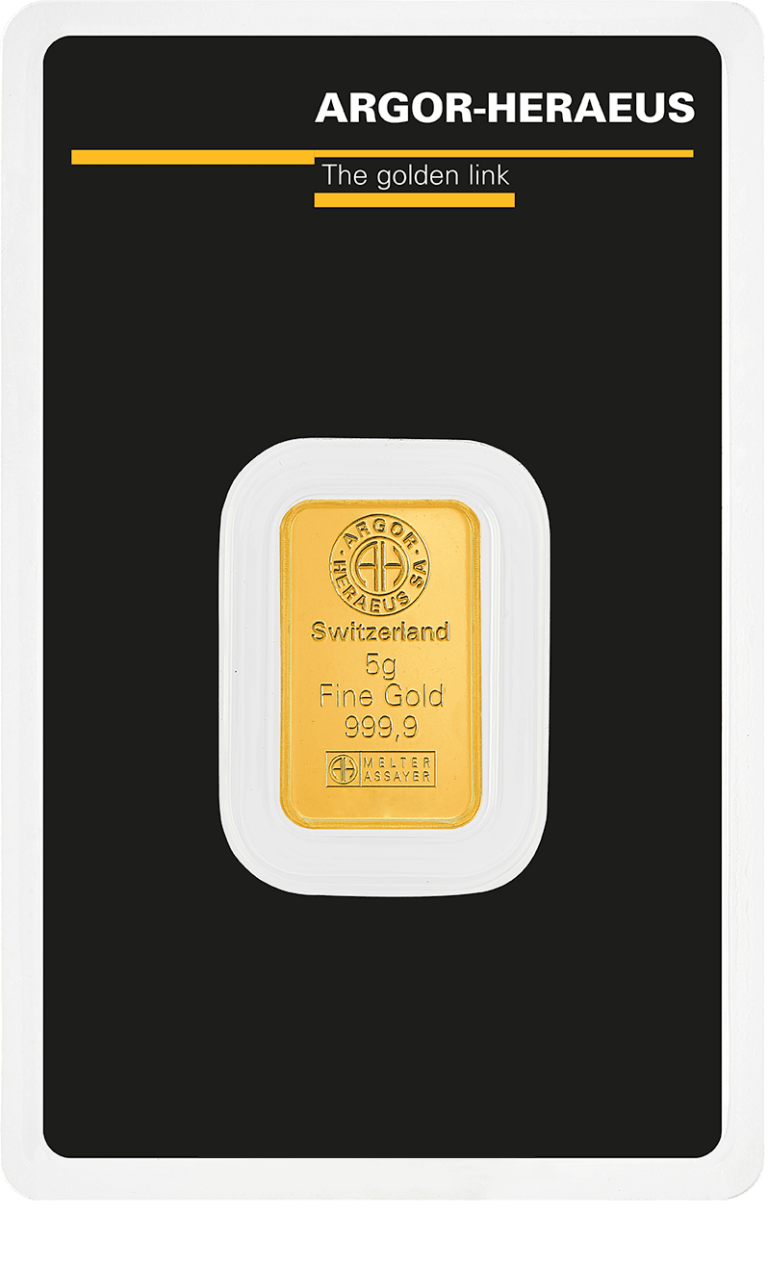
- Fine gold999.9
- Weight5 grams
- ProducerArgor-Heraeus
-
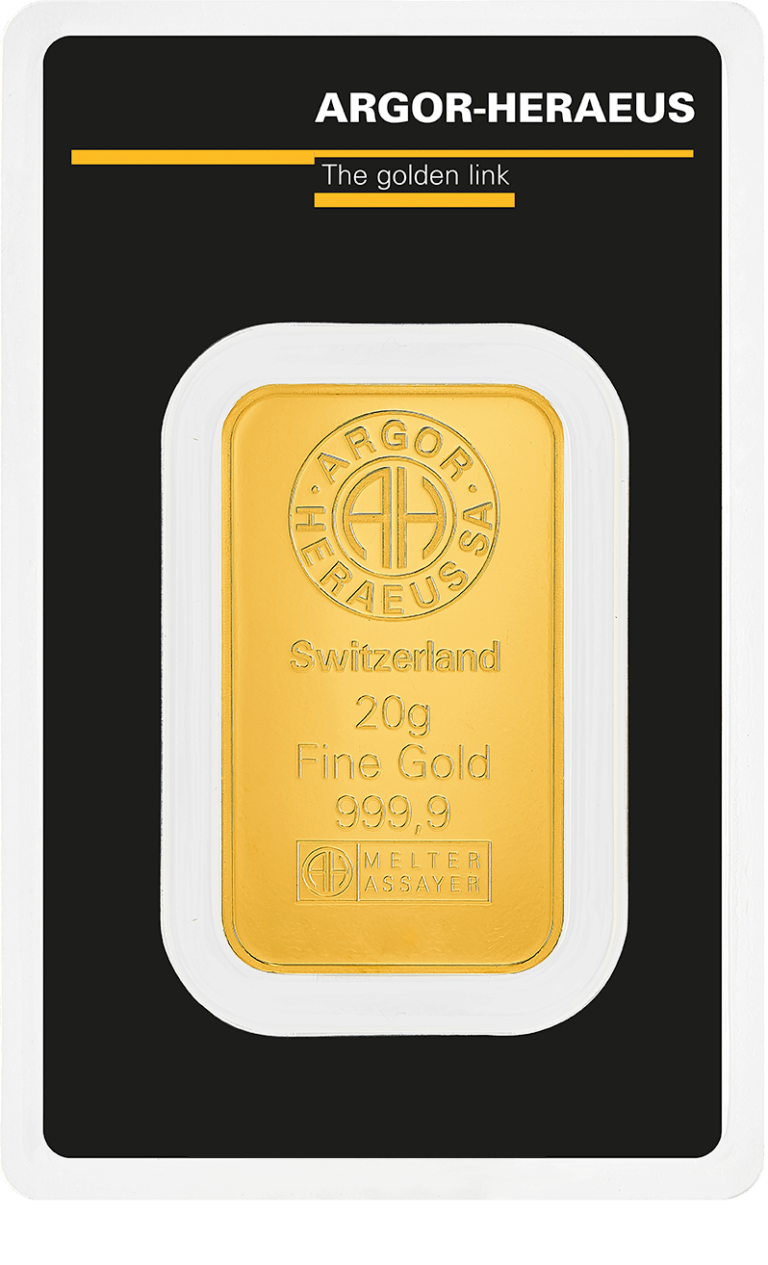
- Fine gold999.9
- Weight20 grams
- ProducerArgor-Heraeus
The interactive chart illustrates gold price performance over the last 10 years, including significant periods of growth, market corrections, and more stable phases. You can view annual averages, compare different periods, and better understand how market dynamics changed under various economic conditions. A longer time horizon also reveals trends that are often difficult to identify in short-term charts.
The 10-year gold price chart shows that the gold market responded to multiple factors simultaneously. Inflation, central bank policies, interest rate movements, and geopolitical events all played an important role. As a result, gold price performance over the past decade was far from uniform—some periods were relatively stable, while others experienced higher volatility and faster investor reactions.
Looking at the entire decade, it becomes clear that gold moved through several economic cycles. This is why a long-term chart is particularly useful for those who are not interested in tracking daily market movements but want to understand the broader picture of gold price performance over time.
View the current gold price and the live gold price chart on DealFin.sk.
Historical Gold Price Performance Over the Last 10 Years
Gold price performance over the past decade offers a completely different perspective than short-term charts. A longer time horizon reveals how the role of gold changed during different economic periods, currency shifts, and geopolitical events. Historical gold price performance also demonstrates that the market responded differently to events depending on the stage of the global economic cycle.
The chart reflects periods following the end of the gold standard, oil crises, financial market disruptions, and times of elevated inflation. Some periods saw a sharp increase in investor demand for gold, while others were marked by greater market stability. Importantly, long-term price performance was shaped not by a single event but by a combination of economic and political factors that evolved over time.
A 10-year perspective highlights relationships that are often not visible in shorter-term charts. It provides a clearer view of market cycles, changes in the value of fiat currencies, and recurring periods of uncertainty during which investors increasingly turned to gold as a store of value.
What Influences the Long-Term Gold Price Trend?
The long-term gold price trend is influenced by several interconnected factors. Inflation, interest rates, central bank policies, and the strength of the U.S. dollar all play a significant role. Demand from investors, central banks, and industry is also an important driver, changing according to global economic conditions.
Short-term market movements are often driven by breaking news or geopolitical events. Long-term trends, however, are generally determined by broader economic factors and complete business cycles. This is why gold price performance over the last 10 years appears more stable than short-term fluctuations, which tend to be more pronounced but less persistent.
Frequently Asked Questions – Historical Gold Price Performance
